Pages

Monday, June 12, 2017

Astro-Geometry (Part-1)


Well, as the title goes, this technique uses both Astrology and Geometry to determine trend reversal. I found this technique useful and came to know about it accidentally. I was doing some research around 5 years ago, and while drawing horizontal lines found this. It is a quite simple technique, might be known to some (?).


The Astrology part of the technique needs a composite longitude of 2 or more planets. But I have not checked or even tried it with more than 2 planets.  Selection of planets is important.


The Geometry part required simple lines, horizontal and vertical.


NOTE:
Both, the stock data chart and composite should be plotted as shown in the below image. There must be a proper scale between the stock data chart and composite. Otherwise, this technique wouldn’t  be of any use.


Below images are self explanatory.


AUDUSD with Ven-Sat Composite (with Single Pair)


AUDUSD with Ven-Sat and Sun-Sat Composites (with Two Pairs)


AUDUSD with Ven-Sat, Sun-Sat and Mar-Sat Composites (with Three Pairs)


When tested with intra-day data, it worked !!

EURUSD - Hourly Chart


Tuesday, May 30, 2017

Combustion of MARS


Mars will be in conjunction with Sun on 27-Jul-2017. The planets when conjuncts Sun, goes through a phenomenon referred as Combustion. Well, this Combustion applies to all planets except North Node (Rahu), South Node (Ketu).

Vedic astrology doesn't consider Uranus, Neptune and Pluto.

To know more about this phenomenon wrt trading, please read the article.

Below images are quite self explanatory.


NIFTY


RELIANCE


EURUSD


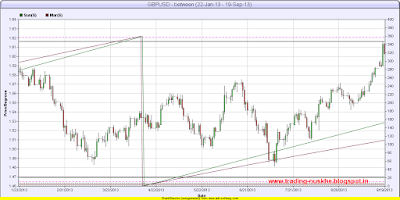
GBPUSD


In image below, I have marked the important dates for the coming conjunction.


Friday, May 12, 2017

Financial Astrology Course - Update


After receiving some mails regarding discounts for the Financial Astrology Course, I have decided to lower the cost and now it will be INR 35000.00. Now no need to ask for any discounts.


Also, some have asked, if they are already aware of the basics, then what will be the cost of the course. I have also updated the cost for the same. The new price will be INR 25000.00.


Course can also be conducted online via Skype.


Monday, April 17, 2017

Astrological Cycles - 2 (Applied to USDJPY)


I have applied 3 astro cycles to USDJPY between 19-Sep-2014 to 30-Jun-2017. I have divided this period into 4 parts, so that the cycles and their effect can be seen clearly.


The cycles applied on USDPY are different from those applied on EURUSD.


19-Sep-2014 to 30-May-2015

Cycle-1

Cycle-2


Cycle-3


31-May-2015 to 08-Feb-2016


Cycle-1


Cycle-2


Cycle-3


09-Feb-2016 to 19-Oct-2016

Cycle-1


Cycle-2


Cycle-3


20-Oct-2016 to 30-Jun-2017

Cycle-1


Cycle-2


Cycle-3


Astrological Cycles - 1 (Applied to EURUSD)


Images are self explanatory. Some images have single cycle and some have more.

I have tried to draw vertical lines straight to the candles, but in some images they are missing. It is quite mind-numbing job to draw number(s) of lines.

In a day or two, will post for USDJPY.

Stay tuned.


Note:  Stock Data taken from Stooq


Tuesday, April 11, 2017

George Bayer Rule No. 2A OR VENUS - Heliocentric Latitude


Before viewing the images, first timers must read the information here.

George Bayer's Rule No. 2A when applied to Currency Pairs...


USDJPY


EURUSD


GBPUSD


Note: Data is taken from Stooq